
Chris Mercer
Chris “Mercer” Mercer, co-founder of MeasurementMarketing.io, is a sought after Measurement Marketing expert. For the past 5 years, Mercer (as he’s known) and his team have been helping marketers, marketing teams, and agencies know, trust, and grow their numbers.
There’s a wall that exists between marketers and data analysts. Most data analysts are crunching numbers and doing linear regression and stats, but don’t know how to apply that data into action. And the marketers aren’t sure what numbers they should be asking for from the data analysts, creating a wall between two different sets of people who should be working together to get optimal results.
In an ideal world, all marketers would be data analysts and all data analysts would be marketers. That way, businesses would be able to analyze the numbers that are coming in and know how to use that data to bring in results.
That’s where Measurement Marketing comes into play.
In Measurement Marketing, we’re using basic math to get better conversions. Measurement Marketers are using numbers to guide businesses to their hidden revenue and achieve higher conversion rates.
The idea behind Measurement Marketing is knowing where to look as a marketer. Understanding basic math and knowing how to interpret analytics and numbers can help you to see the step that you need to focus on.
Numbers Don’t Really Matter
Most marketers wouldn’t necessarily call themselves “numbers people.” Instead marketers tend to be creative, big picture types. Which is why there is this disconnect between data analytics and marketing.
The good news is that when it comes down to it, numbers don’t really matter. The thing that matters is the people. More specifically, the behavior of the people coming to your site. Instead of focusing on what kinds of people are visiting your site, you should be focused on what it is those people are doing once they’re on your site.
The key to understanding the behavior of people who visit your site is to look past the numbers and data you’re receiving, and focus on what those numbers represent.
Track Every Measurable Thing You Can
Once you understand that it’s not the numbers you’re looking for, but the behavior, you can start to track that behavior. From visitors to clicks to scrolls, you should track every measurable thing you can. Tools like Google Tag Manager are easy to understand for even non-number people like creative marketers and can help you track every behavior coming from your different funnels.
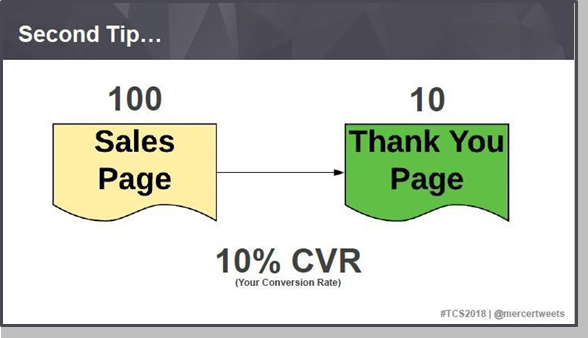
What most people are doing when it comes to measuring behaviors on their site is starting with the conversion rate. This is a great place to start, but tracking your conversion rate is only the tip of the iceberg when it comes to measuring the behavior of your customers.
Tracking your conversion rate is as simple as measuring the amount of people that start at your sales page and make it to the end goal, your thank you page. But what about all the steps that happened in between? One of the biggest mistakes a marketer can make is not considering the behavior of a customer on their journey to the Thank You page.
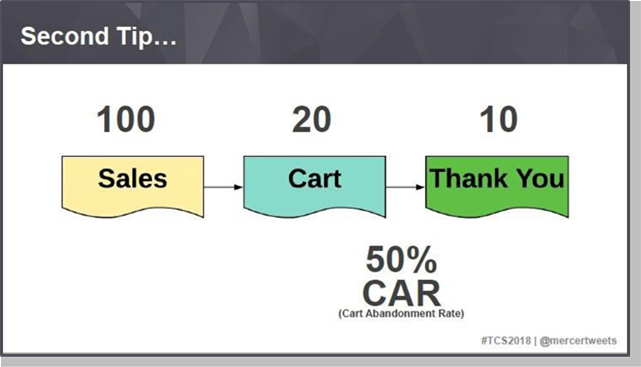
This journey, when we’re talking about sales, usually involves customers interacting with the cart in between the start and the thank you page.
Now that we’re considering the behavior of the cart as well as the overall conversion rate, we’re introducing another measurable behavior into the mix— the CAR (cart abandonment rate).
In this example there is a 50% CAR, which can help you tell you a lot about where the problem is. Why are so many people abandoning the cart and not making it to the final thank you page? Where on your website is the problem, and how can you fix it?
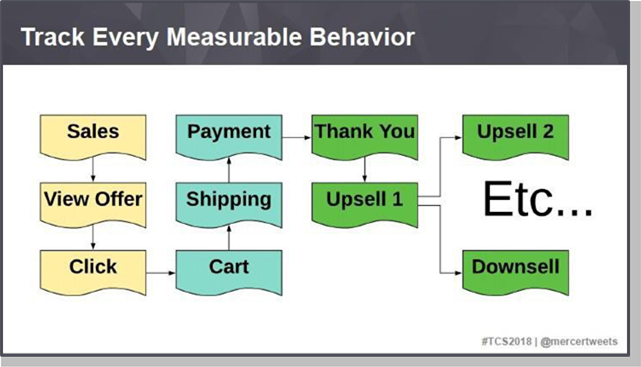
You can go even further into measuring the behavior of your customer on their journey to the thank you page. With the right tools and mindset, you can track every single behavior of your customer from the minute they land on your website, to the minute they pay, including upsells after you make the initial sell.
If you’ve got a conversion rate of 10%, that’s not telling you a lot about how the machine of your business is working. By breaking down every step and measuring every behavior you can pinpoint the problem areas of your machine. Whether that’s the placement of the button on your page, the headline, the lead, or even the copy. It’s impossible to know where this problem is if the only thing you’re measuring is the overall conversion rate.
When you measure properly, you can actually see where things went wrong through your numbers. The numbers and the behaviors are coming directly from your market. In the end, your market is essentially telling you what to do to get them to take the action. All you have to do is listen.
Bad Decisions Come From Bad Numbers
You may have the best intentions of analyzing the numbers and behaviors of your customers, but if your numbers are bad then the decisions you make
based off of those numbers are going to be bad as well.
The truth is that not every analytics formula or data set is created equal. Depending on what kind of data you’re using to analyze your conversions, you could end up with different conversion rates on the same website.
The key to finding good numbers and making good decisions is to focus on the definitions of what those numbers mean.
Definitions Matter the Most
You could say that 100 people are entering your opt-in page and 10 of those people are making it to the end goal, the thank you page. That means you have a conversion rate of 10%.
But what is the definition of “entering”? If we’re defining someone who enters your opt-in page as a unique entrance, meaning they came in twice, then this could change the entire formula and therefore your outcome.
Let’s say out of the 100 entrances you get, 50 of those are unique entrances. If we’re still working with the data of having 10 people land on your thank you page, all of a sudden your conversion rate skyrockets to 20%, doubling itself.
All you had to do was adjust the numbers a bit and not focus on the definition and you double your conversion rate. But with bad numbers come bad decisions. So in order to get an accurate conversion rate using the 50 unique entrances, you need to define what it means to land on the thank you page. If we’re defining entrances in this case as unique, meaning that they entered more than twice, we need to have the same definition for the thank you page.
So now we have 5 unique thank you pages with a total of 50 unique entrances, making our conversion rate 10%. By measuring in multiple places we find the trend. The truth is always in the trend and the power is in the pattern. Don’t just measure one place, measure multiple places and see that the pattern is there. If both of these are saying 10%, chances are your conversion rate is 10%.
Never Trust Just One Source of Data
Relying on one source of data to give you your analytics is a recipe for bad numbers and bad decisions. Just like you should measure your behavior from multiple places, you should use multiple tools to measure your data.
Don’t trust Google Analytics, don’t trust Facebook. Trust Google Analytics and Facebook together.
Instead of putting all your trust in individual tools, you should rely on the trend or the pattern, using a variety of tools and platforms and compare the data given to you until you can identify the trend. Otherwise you’ll find
yourself trying to hammer in a bolt and something will always seem a little off when you try to use your data to make changes in your behaviors.
Why does all this matter?
It matters because if you’re getting the wrong numbers you won’t be able to make the right decisions.
If you have a conversion rate of 10% and you see one of your competitors with a conversion rate of 20% you’re going to be constantly thinking about what you’re doing wrong and trying to find the problem to fix. When in reality, your conversion rate could be 20% as well, but you’re using the wrong tools or the wrong formula to calculate it.
Once you’re working with good numbers and comparing results properly, you can free up your resources and energy to focus on other parts of your business.
Trust But Verify
Trust but verify, or TBV, is the best way to check your data to avoid bad numbers and the bad decisions that follow. This way you can guarantee you can trust what you’re doing is right. The first step is to have trust in yourself and the platform. Have an initial trust that you set everything up right and that the platform’s numbers are correct.
The next step is to go back and verify. Not verify that everything is correct, but verify that it’s wrong.
Instead of looking for validation that you did everything right when you double check, it’s best to assume that you did it wrong and go in with the goal of finding out where things went wrong. Once you spend a while going through and trying to figure out where things went wrong and you can’t pinpoint the place where they did, then you can assume that you got the numbers right.
Benchmarks and Targets
Core Conversion Rate (CVR)
The core conversion rate is how we define that your customers are buying your initial product. This means that they are buying specifically the product that you are marketing towards them, not including measurements of any upsells.
An average core conversion rate is between 1-3%. This 1-3% are considered cold traffic, meaning that these customers have not had any prior marketing like emails or ads sent their way.
It’s important to note that the core conversion rate can also be measured in warm traffic, which can make the numbers and data vary depending on your definition of CVR. Warm traffic are people who you have had contact with in the past and have essentially warmed them up to the sale. The average warm traffic CVR is between 5-10%.
Cart Abandonment Rate (CAR)
The cart abandonment rate generally ranges from 65-85%. The lower you are in this range the better you’re doing. This specific set of data is generally not something you need to put a lot of energy into working to lower…
That is, unless your CAR is towards the higher end of the spectrum. If that is the case, then there are a few things you can do such as looking at how
people are interacting with your cart to try to pinpoint areas of improvement.
Upsell Conversion Rates
In general, your upsell conversion rates are going to range anywhere from
10-20 %. For cold-traffic you should be seeing an opt-in rate for conversion
around 25-35%, meaning that around half of these opt-ins should be included in the upsell conversion rates.
While these numbers are just benchmarks to aim for, your results may vary depending on variables like the type of product and upsells you’re working with.
Opt-in CRV Warm/Cold traffic
Generally speaking, you should see a bump between 45 and 65% when we’re talking about warm versus cold opt-in CRV traffic. That number jumps to 75% when you’re working with affiliate products because it’s targeted to a very specific audience.
Keep in mind that if this rate is hovering around 25%, it’s probably worth checking out to see what’s going wrong. There’s always something you can improve on, whether it’s the swipe or the offer itself that they’re opting-in for.
Average Stick
Average stick on a membership site is around 3-4 months. Sometimes this number can be a little higher, sometimes a little lower. Anything above this is considered great, so keep doing what’s working for you.
If you’re below this, you want to at least get to this point so continue to try to grow it by monitoring customer behavior and improving on problem areas.
Offer to Cart
It’s not often that you find a business that is measuring the offer to cart consistently enough, but this is an important aspect of conversion to measure. Most customers go directly from the sales page into the cart.
It’s a good number to know how many people are coming from the sales page into the cart to tell you the number of people browsing versus buying, and what you can do to up your conversions. The general offer to cart rate is generally around 10%.
Find Your KPIs
Finding your KPIs, or key performance indicators, is essential to understand your data and start using it to get results.
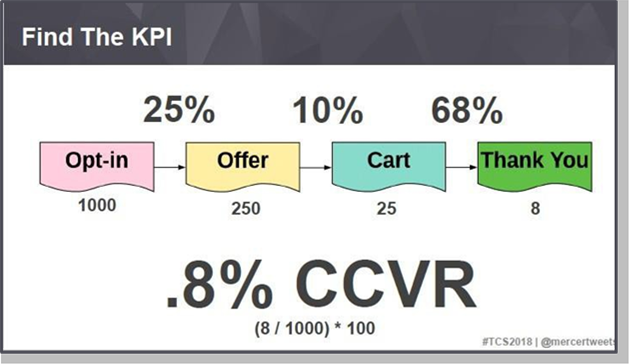
From the opt-ins to the conversion rate, there’s a funnel that your customers are going through. Measuring and understanding the data from each step in your customer’s journey can help you find your KPIs and improve your CVR.
Forecasting the Future—Forecasting 101
Using these tools to measure data is only going to get you so far. You may be measuring everything you’re supposed to using the right methods, but every time you change something your results are the same. Your conversion rate isn’t going up and your results are not improving. The next step is to learn how to forecast the future of your data.
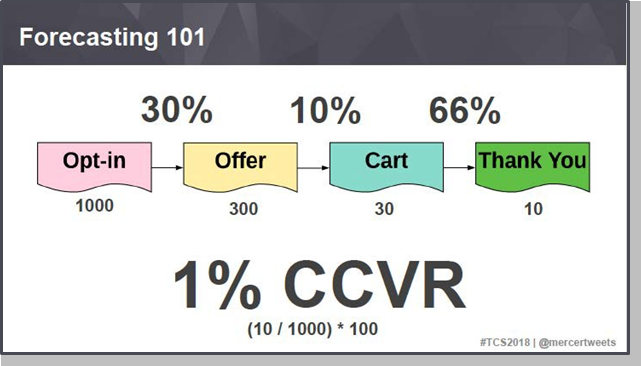
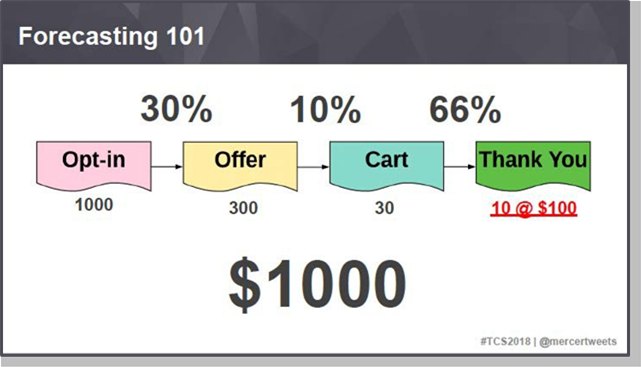
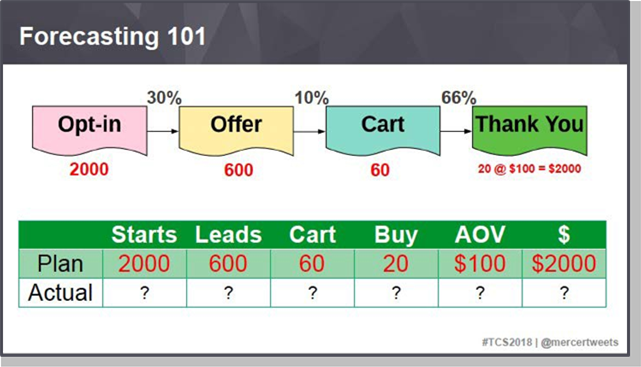
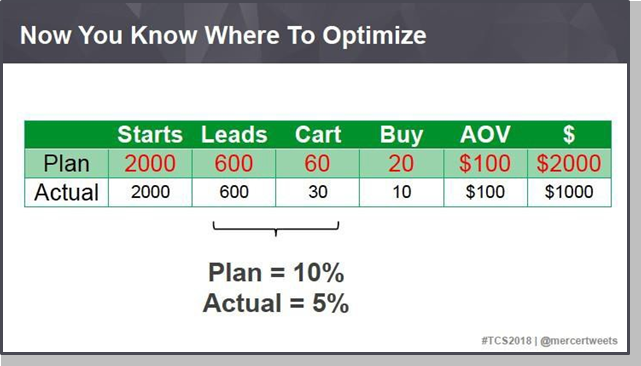
By measuring your numbers, spelling them out, and figuring out what they mean you can have a better understanding of where you need to be. Just like the figures above, you should be breaking things down as far as you can so you can see each individual step in the sales process and the corresponding data.
By laying everything out in an organized manner, the data will tell you what steps you need to focus on. From there you can go in and focus, tweak, and then measure again. The market, or your customers, are telling you how you can optimize your data by giving you access to their behaviors.
Once you pull everything together into a sample size, you should be able to see a pattern emerge. The truth is in the trend and the power is in the pattern.
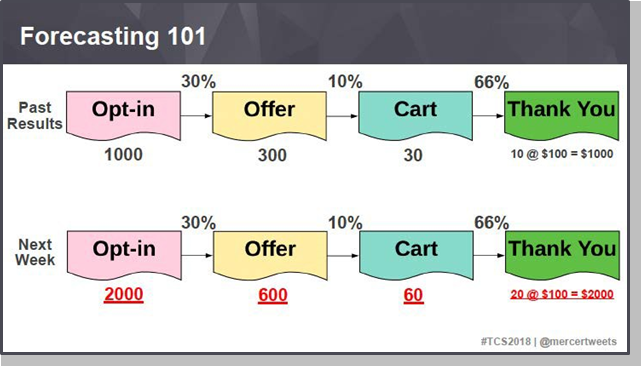
What 98% of marketers are doing wrong when it comes to utilizing this data is they’re looking into the past, scrubbing old reports and searching for the answer in your customers’ past behaviors. When in fact, marketers should be doing the exact opposite and look into the future. When you’re diving through the past, you’re always walking backwards in your marketing techniques and you can’t begin to look forward.
Instead of focusing on the past data and behaviors, focus on the plan for the future. When you begin to ask yourself, specifically, how you are going to reach your targets and your benchmarks and start to draw out a detailed plan, it will force you to come up with thoughts you’ve never considered before.
It will help you tweak and predict the future of your customers’ behaviors. Out of this you will start to have conversations ahead of time that will help you plan and prepare for problems before they even appear.
LTV/VOR
When we’re talking about numbers, there’s a lot going on. It’s hard to figure out what to focus on and wade through the less important numbers to find the ones that really matter.
If you’re struggling to find a number to start with, try focusing on the velocity of return, or VOR. In the world of marketing, it’s not about how much you’re spending, it’s how fact you’re making it back. The goal is not necessarily about the CPA or LTV, it’s about how fast you’re getting back your money.
LTV or lifetime value by itself isn’t the best way to measure your money. But when you start combining LTV data with the VOR, then you can get a better understanding of how much money you’re spending and how fast it’s taking you to make it back.
This ties back to forecasting the future. LTV data by itself is a way to predict the future using data from the past, but just because it happened in the past doesn’t guarantee it to happen in the future. By combining LTV with VOR you can start to define the future as tightly as possible and create longer term cycles than others.
Why Your Dashboards Don’t Work
The reason your dashboards aren’t working is because most people build their dashboards to report data. So you are left with a lot of charts and graphs, but no real to interpret or understand the information that these dashboards are giving you.
What are you supposed to do with all the data that these dashboards are providing? The answer is you don’t know.
The majority of marketers aren’t sure what to do with this data because you need to take the time to analyze and figure out what these dashboards are trying to tell you. In reality, that’s a full-time job in itself and most marketers or business owners don’t have the time or energy to put into that kind of analyzing.
Instead of having dashboards that give you complicated formulas and directions, build a dashboard that answers very specific questions. A quick analysis should be the goal with your dashboards.
Imagine a car dashboard that has a speedometer with formulas and bar graphs that you need to solve in order to figure out how fast or slow you’re going. Your goal with your dashboards is the same with a speedometer, you need it to tell you the data quickly and simply so that you can make a decision based off the information.
Wrapping it Up
Measurement Marketing comes down to a choice. You can continue to do have your marketing be put into a black box where you funnel in money but aren’t sure what results you’re getting or how anything’s working. Or you can take some time to plan it out, build your systems, and spend less money while understanding more.
Measurement Marketing is all about using tools like Google tag manager and Google Data Studio to analyze the right data and understand exactly where you need to focus.